Simple fixed-point integrator
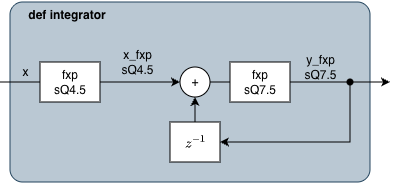
The goal is to implement the fixed-point integrator of this block diagram:
The ovf and rnd arguments of the Q function expect
integers as inputs. For convenience, constants can be imported from the pyfxp.constants
module and used as arguments. Below, the SAT and TRUNC and WRAP constants are imported.
import matplotlib.pyplot as plt
import numpy as np

from pyfxp import FxpSpec, Q, fxp
from pyfxp.constants import SAT, TRUNC, WRAP
We will start by implementing the integrator as a function. The integrator receives two specs:
spec_input: fixed-point specification for the input of the integrator.spec_output: fixed-point specification for the output of the integrator.
def integrator(x: np.ndarray, spec_input: FxpSpec, spec_output: FxpSpec) -> np.ndarray:
    """Example of a simple fixed-point integrator."""
    len_x = len(x)

    # convert float input to sQ4.5 and saturation
    # fxp accepts receiving numpy arrays
    x_fxp = fxp(x, spec_input)

    # implement accumulator
    acc = 0
    y_fxp = np.zeros(len_x)
    for i in range(len_x):
        y_fxp[i] = fxp(acc + x_fxp[i], spec_output)
        acc = y_fxp[i]

    return y_fxp
The fixed-point specifications are created using the Q function. The first spec is used
to convert the input of the integrator to sQ4.5. The second spec sQ7.5 is used for the integrator
output.
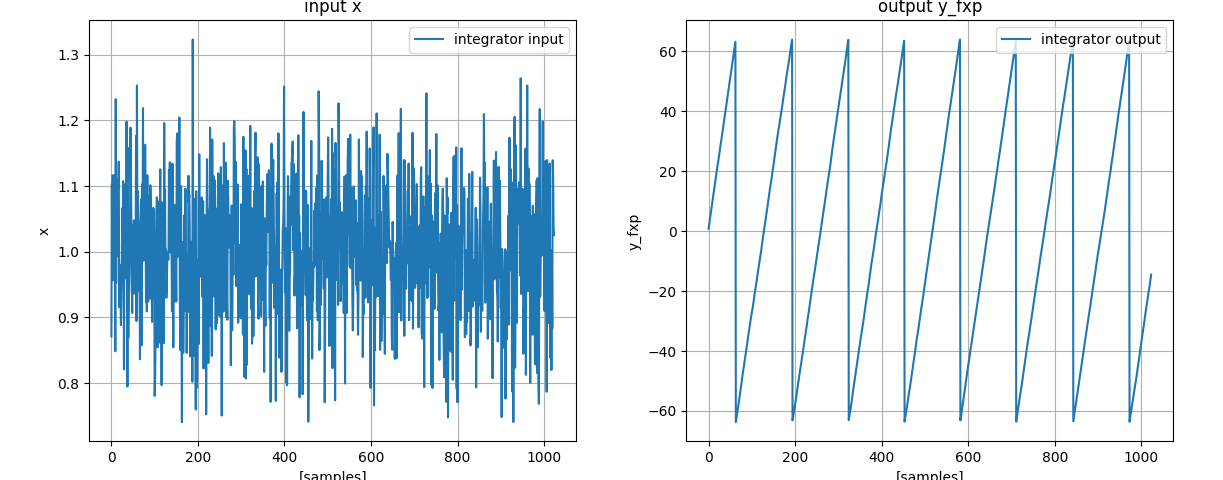
The input stimulus x will be a DC signal with value of 1 with some additive normal noise.
Note that an integrator has infinite gain at DC, and it is expected to overflow for a DC signal.
# Create fixed-point specifications
sQ4_5 = Q(4, 5, rnd=TRUNC, ovf=SAT)
sQ7_5 = Q(7, 5, rnd=TRUNC, ovf=WRAP)

# number of samples used for the simulation
n_smp = 1024

# DC value + normal noise
x = np.ones(n_smp) + np.random.normal(0, 0.1, n_smp)
y_fxp = integrator(x, spec_input=sQ4_5, spec_output=sQ7_5)
Plotting the output shows that the integrator overflows, as expected.
fig, ax = plt.subplots(1, 2)
fig.tight_layout()

ax[0].plot(x, label="integrator input")
ax[0].set_ylabel("x")
ax[0].set_xlabel("[samples]")
ax[0].set_title("input x")
ax[0].legend()
ax[0].grid()

ax[1].plot(y_fxp, label="integrator output")
ax[1].set_xlabel("[samples]")
ax[1].set_ylabel("y_fxp")
ax[1].set_title("output y_fxp")
ax[1].legend()
ax[1].grid()
plt.show()